**Group members participating:** Ivan Grujic, Lasse Brøsted Pedersen, Steffan Lildholdt, René Nilsson
**Group members participating:** Ivan Grujic, Lasse Brøsted Pedersen, Steffan Lildholdt, René Nilsson
**Activity duration:** 5 hours
**Activity duration:**15 hours
## Goal
## Goal
The goal of this exercise is to test three different sensors and physical robot constructions in a self-balancing robot context.
The goal of this exercise is to test three different sensors and physical robot constructions in a self-balancing robot context.
...
@@ -125,7 +125,7 @@ By doing this procedure for each parameter we ended up with the following estima
...
@@ -125,7 +125,7 @@ By doing this procedure for each parameter we ended up with the following estima
With this configuration the robot was able to self-balance in short intervals of approximately 1-2 seconds as seen in the video in the references section.
With this configuration the robot was able to self-balance in short intervals of approximately 1-2 seconds as seen in the video in the references section.
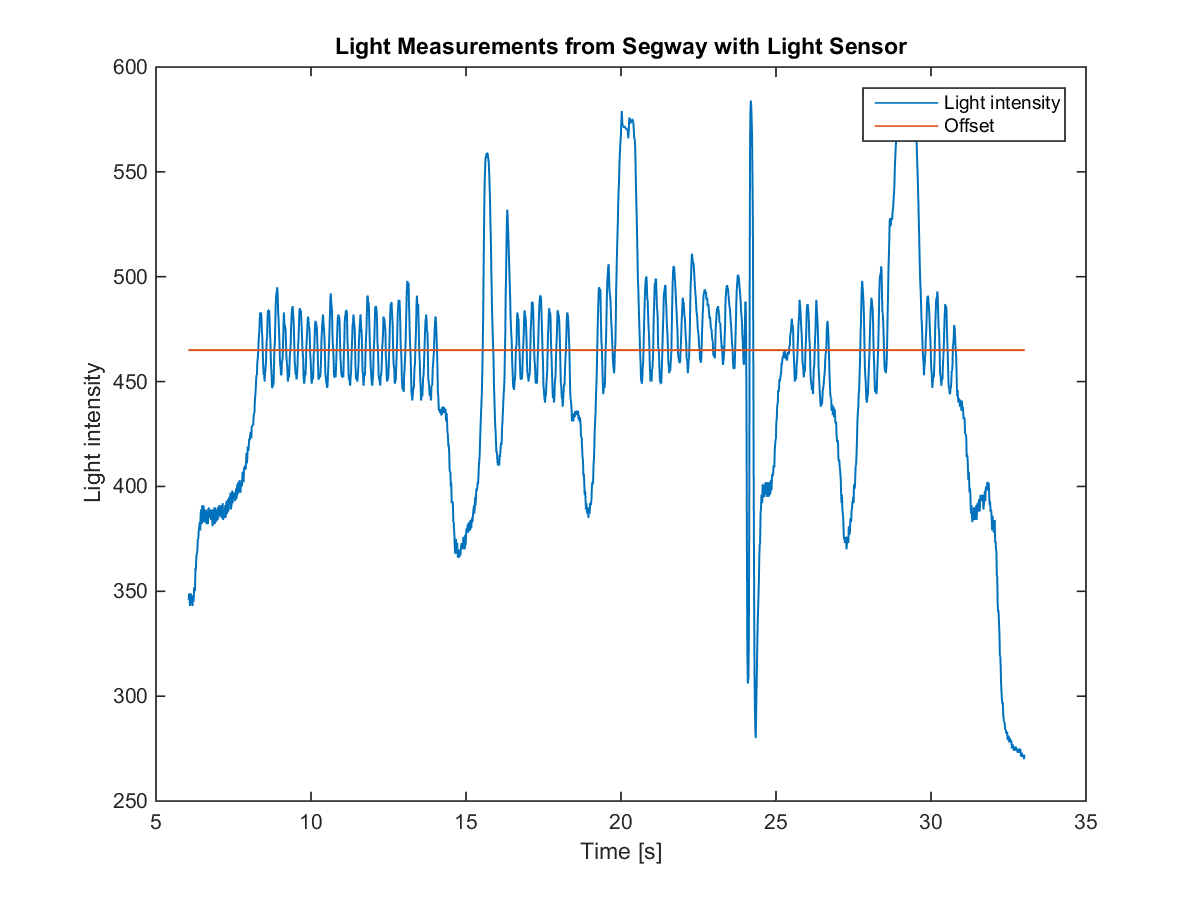
In order to investigate this behavior the data logger is used to collect the light sensor readings during the execution of the program. The end result of this is seen in the following image.
In order to investigate this behavior the data logger is used to collect the light sensor readings during the execution of the program. The end result of this is seen in the following image.


This plot shows the PID controllers offset as the red line and the output of the light sensor as the blue graph.
This plot shows the PID controllers offset as the red line and the output of the light sensor as the blue graph.
When the LEGO robot is tilting forward the light sensor will get closer to the surface which yields less surrounding light coming in. However the output value will increase due to the light sensors ambient light making reflections on the surface. In contrast when the robot is tilting backward the output value of the sensor will decrease due to less reflected light coming in.
When the LEGO robot is tilting forward the light sensor will get closer to the surface which yields less surrounding light coming in. However the output value will increase due to the light sensors ambient light making reflections on the surface. In contrast when the robot is tilting backward the output value of the sensor will decrease due to less reflected light coming in.
...
@@ -179,7 +179,7 @@ A video of the robot balancing with these control parameters applied on the whit
...
@@ -179,7 +179,7 @@ A video of the robot balancing with these control parameters applied on the whit
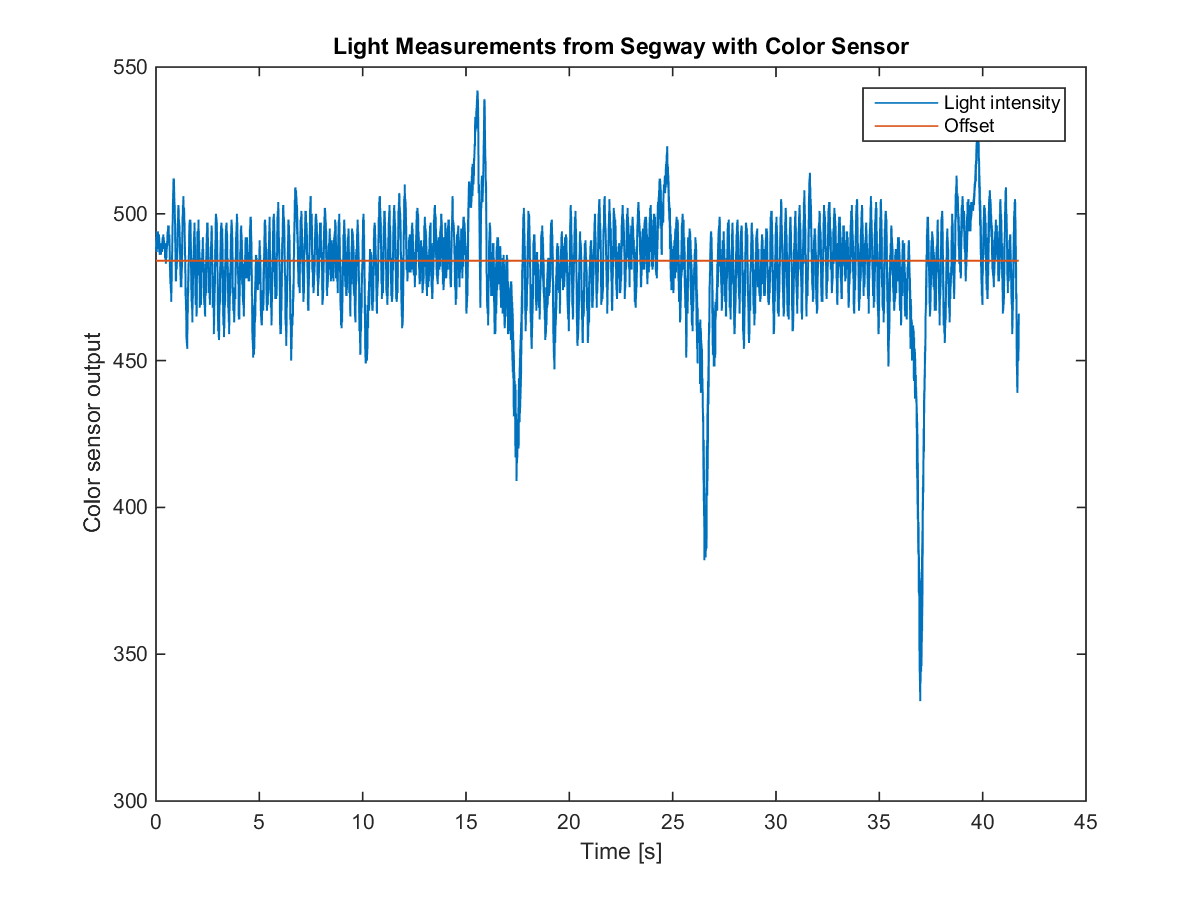
In order to compare these results with the results of exercise 1 the data logger is used to collect the color sensor readings during the execution of the program. The end result of this is seen in the following image.
In order to compare these results with the results of exercise 1 the data logger is used to collect the color sensor readings during the execution of the program. The end result of this is seen in the following image.


This plot shows the light intensity given by the color sensor as the blue graph and the offset is the red line.
This plot shows the light intensity given by the color sensor as the blue graph and the offset is the red line.
...
@@ -307,7 +307,7 @@ In order to investigate the properties of the gyro sensor, it was mounted on the
...
@@ -307,7 +307,7 @@ In order to investigate the properties of the gyro sensor, it was mounted on the
The data shows, that the offset for this sensor is around 600. Furthermore, it can be seen from the data, that the supplied gyro sensor only senses changes to angular velocity in one axis. This can be seen by the three spikes starting just before T = 8. These spikes corresponds the three movements, for a single axis.
The data shows, that the offset for this sensor is around 600. Furthermore, it can be seen from the data, that the supplied gyro sensor only senses changes to angular velocity in one axis. This can be seen by the three spikes starting just before T = 8. These spikes corresponds the three movements, for a single axis.
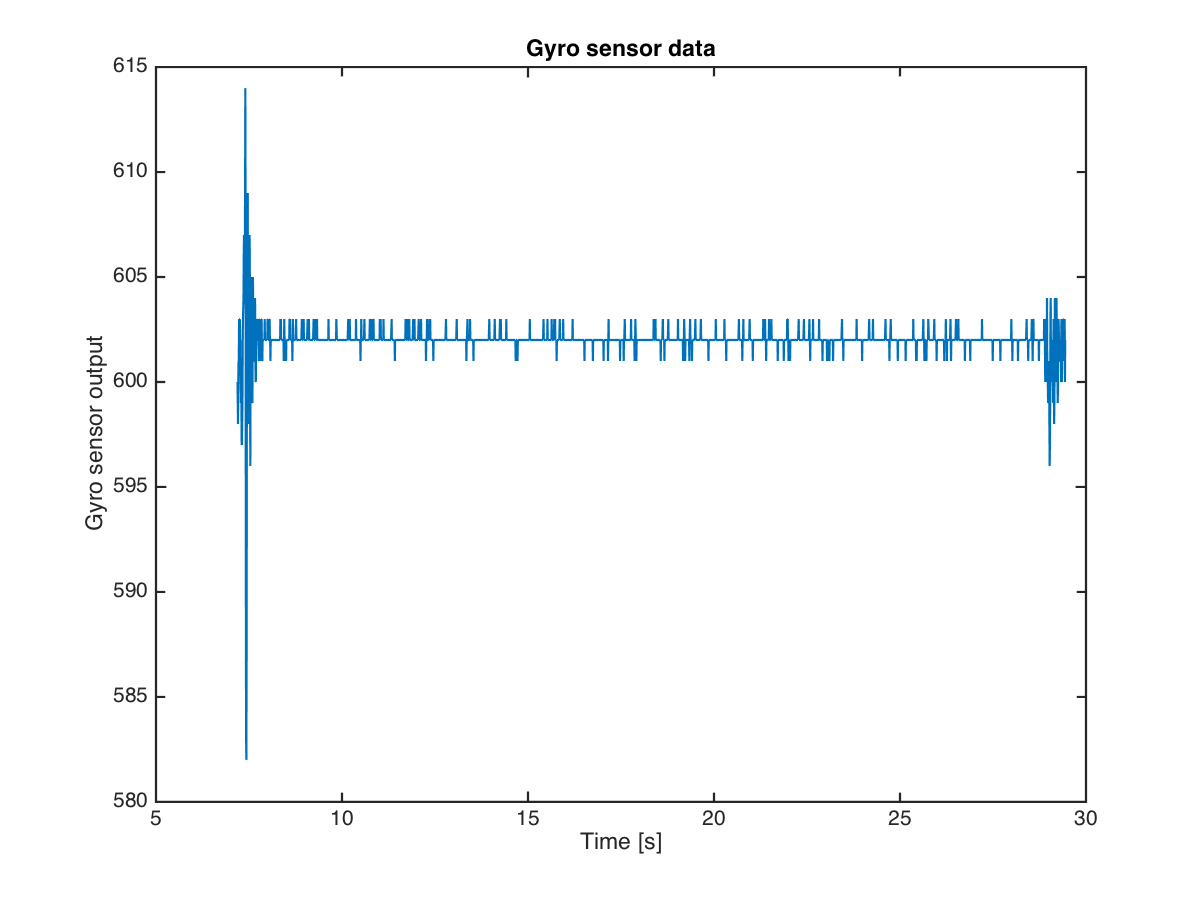
The small fluctuations in the graph is mainly due to an unsteady hand, when turning the robot. In order to test if the gyro drifts, a test was performed, where the gyro sensor was lying completely still. The results from this test is shown in the figure below.
The small fluctuations in the graph is mainly due to an unsteady hand, when turning the robot. In order to test if the gyro drifts, a test was performed, where the gyro sensor was lying completely still. The results from this test is shown in the figure below.


The high variations in the beginning and the end of the graph is due to the button presses to start and stop the test.
The high variations in the beginning and the end of the graph is due to the button presses to start and stop the test.
The output from the gyro sensor is an integer, which causes the output to take discrete values like 601, 602 and 603.
The output from the gyro sensor is an integer, which causes the output to take discrete values like 601, 602 and 603.